Nixtla
Contents
Nixtla#
Have questions? Chat with us on Github or Slack:
Fugue is a low-code unified interface for different computing frameworks such as Spark, Dask and Pandas. Nixtla is an open-source project focused on state-of-the-art time series forecasting. They have a couple of libraries such as StatsForecast for statistical models, NeuralForecast for deep learning, and HierarchicalForecast for forecast aggregations across different levels of hierarchies. These are production-ready time series libraries focused on different modeling techniques.
Setup#
When dealing with large time series data, users normally have to deal with thousands of logically independent time series (think of telemetry of different users or different product sales). In this case, we can train one big model over all of the series, or we can create one model for each series. Both are valid approaches since the bigger model will pick up trends across the population, while training thousands of models may fit individual series data better.
Note: to pick up both the micro and macro trends of the time series population in one model, check the Nixtla HierarchicalForecast library, but this is also more computationally expensive and trickier to scale.
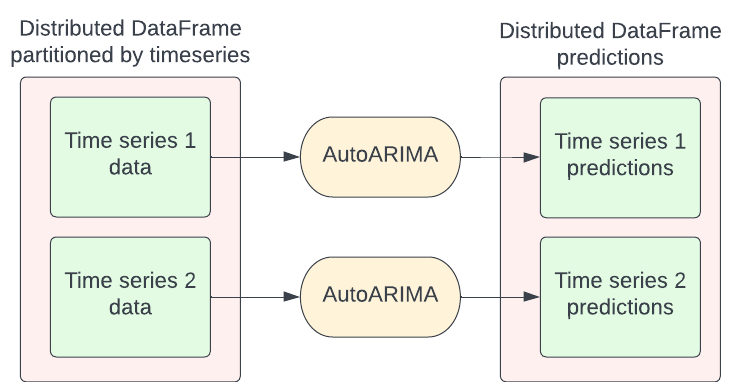
This article will deal with the scenario where we train a couple of models (AutoARIMA or ETS) per univariate time series. For this setup, we group the full data by time series, and then train each model for each group. The image below illustrates this. The input DataFrame can either be a Pandas, Spark or Dask DataFrame.

StatsForecast First Look#
Let’s start with the most standard example, this is how to use the StatsForecast package.
import pandas as pd
from statsforecast.utils import generate_series
from statsforecast.models import AutoARIMA
from statsforecast.core import StatsForecast

series = generate_series(n_series=100, seed=1)

model = StatsForecast(df=series,
                      models=[AutoARIMA()],
                      freq='D',
                      n_jobs=-1)

forecasts = model.forecast(7)
forecasts.head()
| ds | AutoARIMA | |
|---|---|---|
| unique_id | ||
| 0 | 2000-03-28 | 1.626143 |
| 0 | 2000-03-29 | 1.287569 |
| 0 | 2000-03-30 | 1.019489 |
| 0 | 2000-03-31 | 0.807224 |
| 0 | 2000-04-01 | 0.639155 |
Bringing it to Fugue#
We can bring StatsForecast to Fugue using the general transform() function which takes in a general function and distributed it on top of the execution engine. Below is an example of how to wrap the code presented above into a function. The set_index() call is needed because Nixtla assumes the presence of an index. However, Spark DataFrames don’t have an index, so we need to set it inside the function. Similarly, we need to call reset_index() at the end of the function.
The other important thing is that we need to set n_jobs=1 because Nixtla can try to parallelize on a single machine. Using two-stage parallelism (on the Spark level and Nixtla level for example) can often lead to resource contention and bottlenecks in processing. Fugue parallelizes across the partitions defined in the transform() call.
The code below will run on the same data above.
from fugue import transform

def forecast_series(df: pd.DataFrame, models) -> pd.DataFrame:
    tdf = df.set_index("unique_id")
    model = StatsForecast(df=tdf, models=models, freq='D', n_jobs=1)
    return model.forecast(7).reset_index()

transform(series.reset_index(),
          forecast_series,
          params=dict(models=[AutoARIMA()]),
          schema="unique_id:int, ds:date, AutoARIMA:float",
          partition={"by": "unique_id"},
          engine="spark"
          ).show(5)
[Stage 5:> (0 + 1) / 1]
+---------+----------+----------+
|unique_id|        ds| AutoARIMA|
+---------+----------+----------+
|        0|2000-03-28| 1.6261432|
|        0|2000-03-29| 1.2875694|
|        0|2000-03-30| 1.0194888|
|        0|2000-03-31| 0.8072244|
|        0|2000-04-01|0.63915485|
+---------+----------+----------+
only showing top 5 rows
Running with the Fugue transform() with Spark may be slower for small data. This is because there will be an overhead to distribute and spinning up Spark.
Forecast function#
To simplify the user experience for using StatsForecast on top of Spark, Dask, and Ray, a FugueBackend and forecast() function were added to the statsforecast library. Users can pass in a DataFrame or file path as the first argument. The advantage of using the file path is that Fugue can use the backend to load the file as well. For example, if the backend is using Spark, we can load the file distributedly using Spark.
Again, FugueBackend can take in any execution engine. This is just an example where we pass in the SparkSession directly but we can also pass in a Ray or Dask client. We can also pass the string as seen above.
from statsforecast.distributed.utils import forecast
from statsforecast.distributed.fugue import FugueBackend
from statsforecast.models import AutoARIMA

series.to_parquet("/tmp/100.parquet")

from pyspark.sql import SparkSession

spark = SparkSession.builder.getOrCreate()
backend = FugueBackend(spark, {"fugue.spark.use_pandas_udf":True})

forecast("/tmp/100.parquet",
         [AutoARIMA()],
         freq="D",
         h=7,
         parallel=backend).toPandas().head()
| ds | unique_id | AutoARIMA | |
|---|---|---|---|
| 0 | 2000-03-27 18:00:00 | 0 | 1.626143 |
| 1 | 2000-03-28 18:00:00 | 0 | 1.287569 |
| 2 | 2000-03-29 18:00:00 | 0 | 1.019489 |
| 3 | 2000-03-30 18:00:00 | 0 | 0.807224 |
| 4 | 2000-03-31 18:00:00 | 0 | 0.639155 |


